 |
Issue 32 (1/2011)
|
|||
FSD Bulletin is the electronic newsletter of the Finnish Social Science Data Archive. The Bulletin provides information and news related to the data archive and social science research.
|
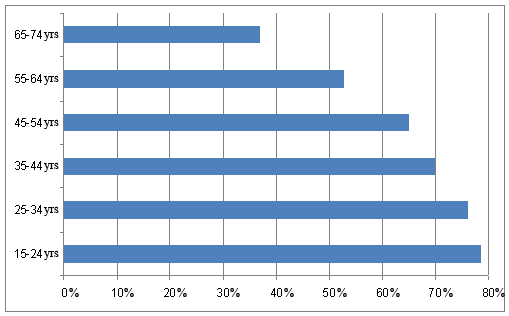
ISSP 2010 in Finland: Online Questionnaires Proved PopularArticle: Seppo Antikainen and Mari Kleemola. Figures: Markku Nieminen Since the year 2000, the FSD, Statistics Finland and the department of Social Research at the University of Tampere have carried out the Finnish part of the cross-national ISSP survey. Statistics Finland collects the data with postal surveys. Over the past two years, the respondents have been given the option to answer an online questionnaire in lieu of a postal survey. Over half chose the online questionnaireThe year 2010 ISSP data were collected both through a postal survey and an internet survey. First, the respondents were sent an explanatory letter saying that they can choose either to answer the traditional mail survey or the Internet survey. Each explanatory letter contained an individual user code and a password to the online survey. Those who had not responded to the online questionnaire by a certain date were sent the postal survey. The majority (62,6%) chose to answer online. As expected, this option was the most popular in younger age groups: four fifths of the 15-24 year-old respondents filled in the online questionnaire. Even though it was less popular among the older age groups, even of the 65-74 year-olds more than one third (37,1%) answered online.
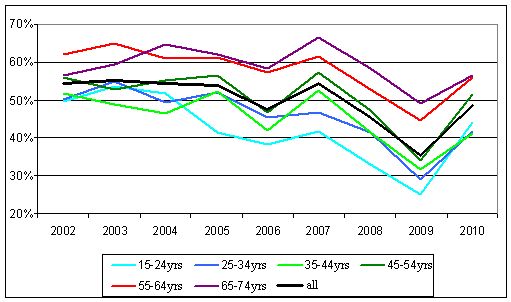
Figure 1: Respondent age group and the proportion of age group answering the ISSP 2010 survey online. Variation in response rateThe response rate for the 2010 survey reached almost 50% which can be considered satisfactory, particularly compared to 2009 when the response rate was only 35,5%. Still, the overall tendency is that response rates are falling.
Figure 2: ISSP response rate by age group over the years 2002-2010. When comparing the response rates of different survey years, it is good to remember that the ISSP has rotating themes. The 2010 theme was environment which the respondents probably found interesting. On the other hand, the response rate in the previous round of the environment survey some ten years ago was as high as 61,3%. The theme in 2009 was social inequality which many may have found a somewhat difficult issue. The time period of data collection may also influence response rate. ISSP surveys are always conducted towards the end of the year but the start and end dates vary. In 2009, data collection ended before Christmas while in 2010 people had time to respond till 6 January. The novelty in 2010 was a price draw for those who had completed the survey (and for postal surveys, returned it), offering two mini laptops worth 300 euros as the price. It is hard to say what the real impact of the price draw was. However, we do believe the laptops were an inducement and might explain why the response rate rose particularly among young people. Sources and more information:
|